Explore the Quality Glossary
Browse and search core QA/QC terminology used in audits, sampling, SPC, and supplier quality. Begin typing a keyword to jump straight to the right definition.
Accept / Reject Criteria
This refers to the measurement and decision of whether or not the quality and performance of a product or service is acceptable. These criteria can be technical specifications (such as level of size tolerances allowed in parts), contract terms and conditions, or performance of a process or service. Implied in the term is the idea that all processes, products, and actions should have an assigned level of acceptable performance that one can measure. Consistent with the understanding that criteria grow out of process capabilities, technicians should periodically measure for acceptability to find out how well a process or item is meeting specification.
Acceptable Quality Level (AQL)
AQL is limit of a satisfactory process average at a particular quality level when a continuing series of lots is considered.
Acceptance Number
In judging the acceptability of a lot or batch, this is the maximum number of nonconformities allowed within a sample, based on a count of the nonconformities. If the batch passes, that is, it’s amount of nonconformities falls at or below the acceptance number. If a batch does not pass, this usually indicates there is a problem with the process.
Acceptance Sampling Plan
This is a plan for setting up the acceptable sampling technique that includes criteria setting sample size, and for accepting and rejecting a component, product, or service based on samples meeting prescribed quality criteria. Plans may involve single, double, sequential, chain, multiple, or skip-lot sampling techniques. With variable samples, management may deploy single, double, and sequential sampling techniques.
Adequacy of Standards
This is a manufacturing term that refers to the ability of a standard to be used for calibrating the accuracy of a gage or instrument used to measure quality or performance. It is best if such standards are traceable to the National Bureau of Standards. The term also appears when dealing with the measurement of processes and procedures.
Affinity Diagramming
This is a technique for organizing a variety of subjective data into categories based on the intuitive relationships among individual pieces of information. It is often used by groups to find commonalties among concerns and ideas on any subject from members. In this technique, you organize information into logical groups.
Agile Manufacturing
This is a set of flexible manufacturing processes that leads to the rapid design and manufacture of products that provides customers with what they want, when and where they want it. Using agile manufacturing rather than traditional manufacturing methods, firms can offer more customized products at competitive prices with no compromise in quality or damage to the environment.
Analysis of Means (ANOM)
This is a statistical technique used when running experiments to identify problems and/or capabilities of an industrial process to deliver an end product with the desirable characteristics.
Analysis of Variance (ANOVA)
This is a method for breaking down and analyzing the total variation in the outputs of any process, understanding the causes of this variation, and then assessing their significance. The goal is to come up with a process in which variation in outputs will be minimized.
AOQ
This is an acronym for average outgoing quality. This refers to the maximum percent of defective products that can go to a customer after inspection is performed by an acceptance-sampling plan. AOQ requires 100 percent inspection if defectives in a batch or lot of products exceed some minimum standard. This helps reassure customers that suppliers will deliver products that will not include more defectives than expected.
Audit (Quality)
An independent review conducted to compare some aspect of quality performance with a standard for that performance.
Average Run Length (ARL)
Assuming a process is in statistical control and the upper and lower control limits are known, the ARL is the expected number of subgroups inspected and measured before an operator detects whether a process has shifted to a new level of control with a new center line and control limits. There are statistical methods for calculating the ARL.
Batch
A definite quantity of some product or material produced under conditions that are considered uniform.
Bathtub Curve
This is a composite curve derived from data on early failure rates and constant failure rates combined with a normalized curve of wear-out failure rates. This curve is used in assessing products that have a certain degree of reliability over time. It assumes that failures will either come early on in product life or late in the product life. Between early and late, the rate of failure is lower and generally constant over the life of the product.
Bimodal Distribution
This is a distribution with two modes in the frequency of occurrence of whatever the population is being measured. It is usually displayed using a histogram. The bimodal distribution documents a relationship between two factors in a process, such as time of day and level of traffic.
Calibration
In quality management, this is a comparison of one measurement system or instrument not verified as accurate to another standard measurement system or instrument with verified accuracy. This is done to identify variations from a required specification for performance.
Capability Process Index (Cp)
This is a technique for making a ratio of the specification width (the range within which an output is considered to meet specification) in relation to the process’s natural distribution for assessing whether the process can regularly meet specifications. Process capability is used to determine which processes are not capable of meeting specifications, to identify those processes operating suboptimally, and to estimate the output proportion that will not conform to specifications.
Causal Analysis
This technique concentrates on identifying specific failures or defects, discovering root causes of those failures, and concluding with recommendations on how to eliminate those defects by implementing solutions that address the appropriate cause.
Continuous Sampling Plan
This is an approach to sampling that is most appropriate for the output of processes that deliver a continuous flow of a product. In this plan, a company begins by inspecting 100 percent of the units coming from the process. After a certain number of items that have been inspected with no defects, the plan goes to inspecting only a fraction of items. This continues until the company finds a nonconforming unit. At that point, the plan reverts back to 100 percent inspection following the same pattern.
Control Chart
This is a graph and a statistical process control method used to track the capability and performance of a process over time.
Control Chart Factor
This is a factor based on mathematical probability that facilitates the calculation of control limits on X-bar and range charts.
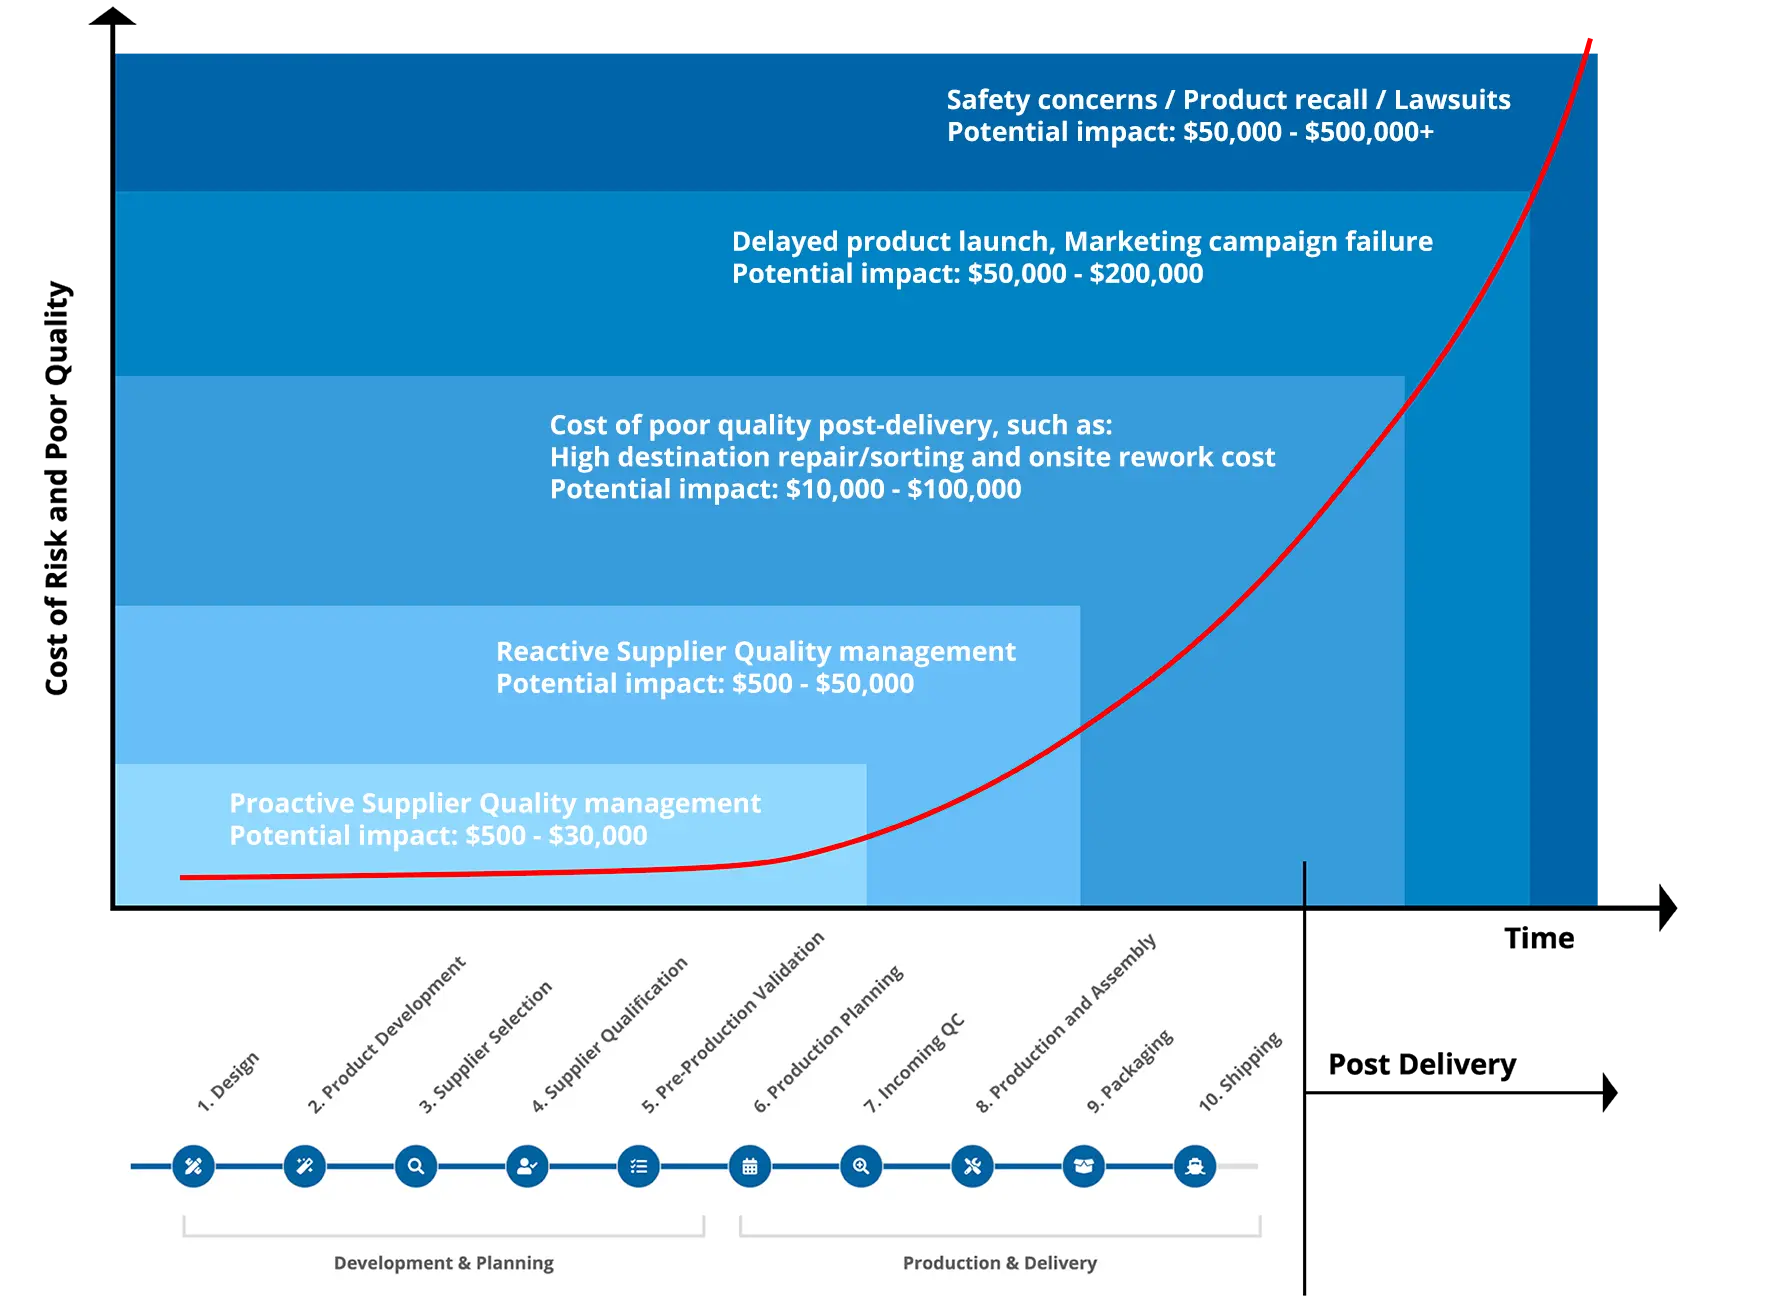
Cost of Poor Quality (COPQ)
Cost of Poor Quality (COPQ) is defined as the costs associated with providing poor-quality products or services. There are internal and external COPQ elements as below:
- Internal COPQ such as waste, scrap, labor, rework time, and administrative costs
- External COPQ, which are typically extremely costly such as product recall, repair and servicing, warranty claims, product return, lawsuits, and marketing disasters
These quality risks and COPQ can be found in every stage of your supplier management journey, and the COPQ increases exponentially as it moves downstream. The earlier these risks are identified and proactively prevented, the less it will cost the company in the long run.
A few pre-emptive supplier quality audits and proactive supplier development initiatives will always outweigh the potential cost of product recalls, safety compliance lawsuits, and marketing PR disasters.
Cost of Quality (COQ)
This refers to all costs involved in the prevention of defects, assessments of process performance, and measurement of financial consequences. Cost of quality is the cost justification of quality efforts.
Critical Defect
This is a defect that, based on experience, is considered hazardous to employees or to have the potential to harm or injure end users of a product or process.
Defect
This is (a) any nonconformance from a customer’s requirement (b) any attribute of a product or service that fails to meet specifications (c) any state of unfitness for use. Defects are usually cataloged into four types by degree, being very serious, serious, major and minor.
Demerit Chart
This is a tool for tracking defects, or various types in process outputs. This type of chart is a way to measure the quality of outputs from a process. Demerits are usually broken down into the four categories of defects: critical, serious, major and minor. These are given weights, and each type is then tracked for a specified number of demerits by the total number of products. Using this as a baseline, the companies can then track additional lots or batches of outputs to measure improvement.
Design of experiments (DOE)
This is a formal branch of applied statistics that focuses on planning, conducting, studying and interpreting the results of controlled tests. Genichi Taguchi, a Japanese quality expert, is a pioneer in developing the DOE approach. Common steps in DOE are to (1) define a problem to be solved; (2) list the factors that might affect the way the process operates; (3) conduct experiments that allow for different combinations of these factors to be studied; (4) choose the combination that yields the best result.
Double sampling
This is an inspection technique in which you inspect a first lot of n1 size, which leads you either to accept or reject it. If you reject it, then you inspect a second sample of a larger lot size n2, which in turn leads to a decision to accept or reject the lot.
Failure Mode Effects Analysis (FMEA)
This is a method for designing in reliability and minimizing the causes of failure in a product. It focuses on analyzing origins of product failure by examining raw materials, components, and assembly processes. The goal is to determine the probability of failure in these items and take preventive action based on this analysis.
Inspection
This includes the acts of measuring, testing, examining, or gaging one or more characteristics of the output of a process and then comparing results to specified requirements. The objective is to determine if the output features conform to the specifications of size, function, appearance, and other characteristics that may be relevant to the product or service.
ISO 9000 Standards
This is a set of quality standards developed in 1987 by the International Organization for Standardization. The three major areas of certification are as follows: ISO 9001, ISO 9002 andISO 9003.
- ISO 9001: which covers all the processes of a company from design and development to procurement, production, testing, installation and service.
- ISO 9002: which covers everything except design and development
- ISO 9003: which covers only inspection and testing.
Lot Tolerance Percent Defective (LTPD)
This is a way of quantitatively defining the relationship between the probability of acceptance by a customer of a product lot compared to the possible percent of defectives within that lot. This relationship shows that the higher the percent of defectives, the lower the probability of accepting the lot.
Lower Control Limit (LCL)
This is the line on a control chart indicating the lower limit within which a process is in statistical control. The LCL is positioned on the chart three standard deviations below the average of the measurements of process outputs through time.
Minimum Acceptable Quality
This is the maximum level of defectives or variants in a specified quantity of products, components, or services that, for purposes of quality sampling, can be considered satisfactory as the average for the outputs delivered by a process.
Nondestructive Testing and Evaluation (NDE or NDT)
This refers to testing and evaluation techniques that do not damage or destroy what is being tested, such as products or parts.
Number of Defective Units Chart (np Chart)
This kind of control chart is used to evaluate the stability of a process by looking at the total number of units with particular defects from a series of lots in which the sample size from each lot remains constant.
Pareto Chart
The Pareto Chart is based on the 80/20 rule and illustrates, in descending order, the frequency of occurrence of particular events or process outputs.
Process Quality Audit
This is an analysis, appraisal, and evaluation of process performance against certain standards. The audit includes an evaluation of how operators maintain process quality and make accept/reject decisions about outputs.
Q9000 Series
This is an abbreviation for ANSI/ASQC Q9000-1 series of standards, the U.S. version of ISO 9000 standards, adopted by the American National Standards Institute in 1987. They are quality standards, documentation, and audit procedures for a variety of activities performed primarily by manufacturing organizations.
Quality Control
This term refers to those activities a company and its employees undertake to ensure that organizational processes deliver high-quality products or services.
Quality Engineering
This incorporates the skills and expertise needed to apply statistical quality control techniques in the design and implementation of manufacturing processes to assure they operate efficiently, improve continuously, and deliver products that are free of defects and with minimum variation.
Random Sampling
This is a standard sampling method by which random samples of units are chosen such that all combinations of these units have an equal chance of being chosen as the sample.
Reliability Engineering
This is the branch of engineering devoted to improving product performance. It includes a set of practices that focus on accurately predicting when and under what circumstance products or processes might fail or not deliver acceptable outputs.
Representative Sampling
This is a process by which samples are pulled from batches or lots of units so as to contain minimum bias between the values of the samples characteristics and the batch, or lot, as a whole.
Sample
This refers to a specific number of items of a similar type taken from a population or lot, for the purpose of examination, to determine all members of the population or lot conform to quality requirements or specifications.
Statistical Process Control
This is the body of statistical techniques used to measure and monitor the performance of processes. The reason for applying these is to identify specific areas for improvement in processes and to measure variation in outputs of processes, all leading to actions that will reduce variation in outputs.
Statistical Quality Control
This is a broader term than statistical process control, implying the use of statistical techniques to measure and improve processes and quality.
Taguchi Methods
Named after Genichi Taguchi, a leading Japanese expert on quality improvement, these methods comprise a variety of techniques for evaluating quality and figuring out how to improve it. Taguchi based his methods on the idea that any variation from customer requirements represents a loss to customers and to the company.
Variation
This is an idea that suggests there will always be some difference between any two or more actions within a system and in the outputs of that system.
Click Below to Improve Product Quality with Pro QC
Contact usGet a Quote or Book a Service
We will be happy to give you more information about our quality solutions. Please fill in this form to contact us. We will respond as soon as possible.
If you would like to submit your CV, please click here.
Contact Us by Email
Contact Us by Phone
North America
+1 206 397 1145
Mexico
+52 55 9990 7885
Colombia
+57 601 9190355
United Kingdom
+44 330 094 5589
France
+33 9 7303 6784
Germany
+49 15630 810151
Australia
+61 2 8252 7691
India & South Asia
+91 227 189 7407
Asia & Asia Pacific
+886 2 2832 2990
Stability
Pro QC has been providing quality assurance, engineering and consulting services since 1984.
Global Presence
We offer a dedicated Account Manager and quality solutions in over 100 countries.
Timely Feedback
We offer online reporting and detailed reports within 24 hours of job completion.
Quality Experts
Our global engineering team has the requisite industry expertise to verify quality and conformance.